Pattern 2.6
Follow the Work
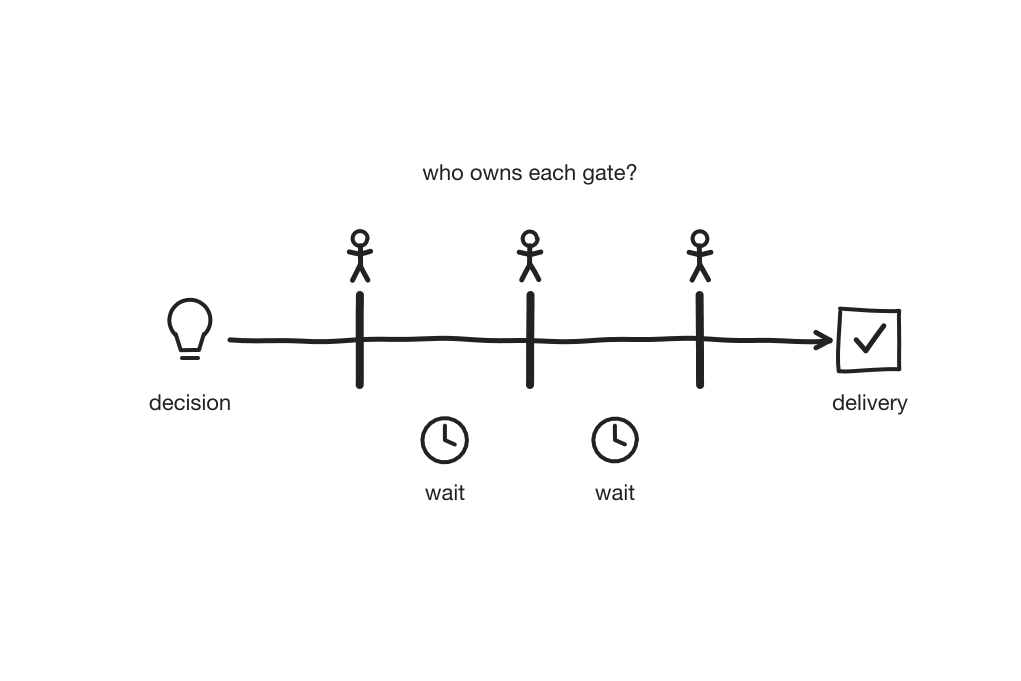
Take one real piece of work and trace every step from the decision to do it to its delivery, and find where it waited and who owned each gate.
In This Context
In many large or regulated organizations, the effort of getting a change into production far outweighs the effort of making it. Delivery problems get blamed on engineering (“IT is always slow”), and engineers blame the change board or the test environments. Neither side usually sees the steps before an engineer starts work: the business case, the estimate, budget approval, prioritization, and procurement. These are often where the longest waits are, and their owners may not think they have anything to do with software delivery. A wait that follows the financial calendar, such as a quarterly investment committee or a freeze at year end, shows that the money’s timetable is setting the pace.
- Ask people about a hypothetical change and they describe the official process.
- Work that goes faster by an informal route depends on goodwill, which money pressure can take away.
- A request that sits in someone’s inbox looks the same as one being worked on.
Therefore
Pick a real, recent piece of work and map it as a value stream, starting from the decision to do it rather than when the ticket was opened. For an operations-focused team, map a real P1 incident from detection through to prevention instead. Mark every wait and every gate, and note who owns it.
- Invite the owners of the gates, including finance and procurement, or list them for follow-up one-on-ones.
- Hold back from fixing the waits on the spot. Most waits are symptoms, and fixing one usually moves the wait somewhere else.
Consequently
- The longest waits often turn out to lie on boundaries already drawn on the patron and organization maps.
- The people who own the gates, and the people slowed down by them, finally see the same process side by side.
- Queues can be counted, so a wait can be connected to a cost (see Chapter 13, sidebar “Little’s Law”).
- The gate owners are often acting exactly as they are measured, so the answer is rarely to blame them, and may lie outside the team’s control.
Seen In
Chapter 13, figure “Following Ravi’s feature request through CapitalMesh, with waits drawn to scale and gates colored by owner type”, Chapter 13, sidebar “War Story: Nine Months for Three Weeks’ Work”. Also: Chapter 13, table “Where work waits, and why”, Chapter 13, sidebar “War Story: The Best Price Nobody Used”, Chapter 13, “A Worked Example: CapitalMesh”.